
What Data-Driven Leaders Do Differently
The #1 leadership quality we look for in PE-backed executives (and how to test for it)

What separates the best leaders from everyone else?
It’s not intellect or charisma. Sure, those things help. It’s a lot easier to get others to follow you if you can accurately diagnose what’s going on and convince people to get onboard with your plan.
But in my world of private equity, there’s a single leadership quality that’s more important than any of that “executive presence” stuff. It’s a different kind of leadership. A kind that’s more about being honest than it is about being inspiring.
I’m talking about data-driven leadership.
Data-driven leaders are the kind of people who not only know their numbers, they also use their numbers to stay connected to what’s going on inside the business. They spend extra time to make sure they’re tracking the right metrics, staying attuned to what the data is telling them, and tapping into the powerful three-part combination of instincts, observations, and quantitative signals.
An important note: The best leaders don’t think about this data-driven thing as extra-credit. They don’t think about it as a way to look good in front of the board. They think about it as their job; as part of their identity as leaders.
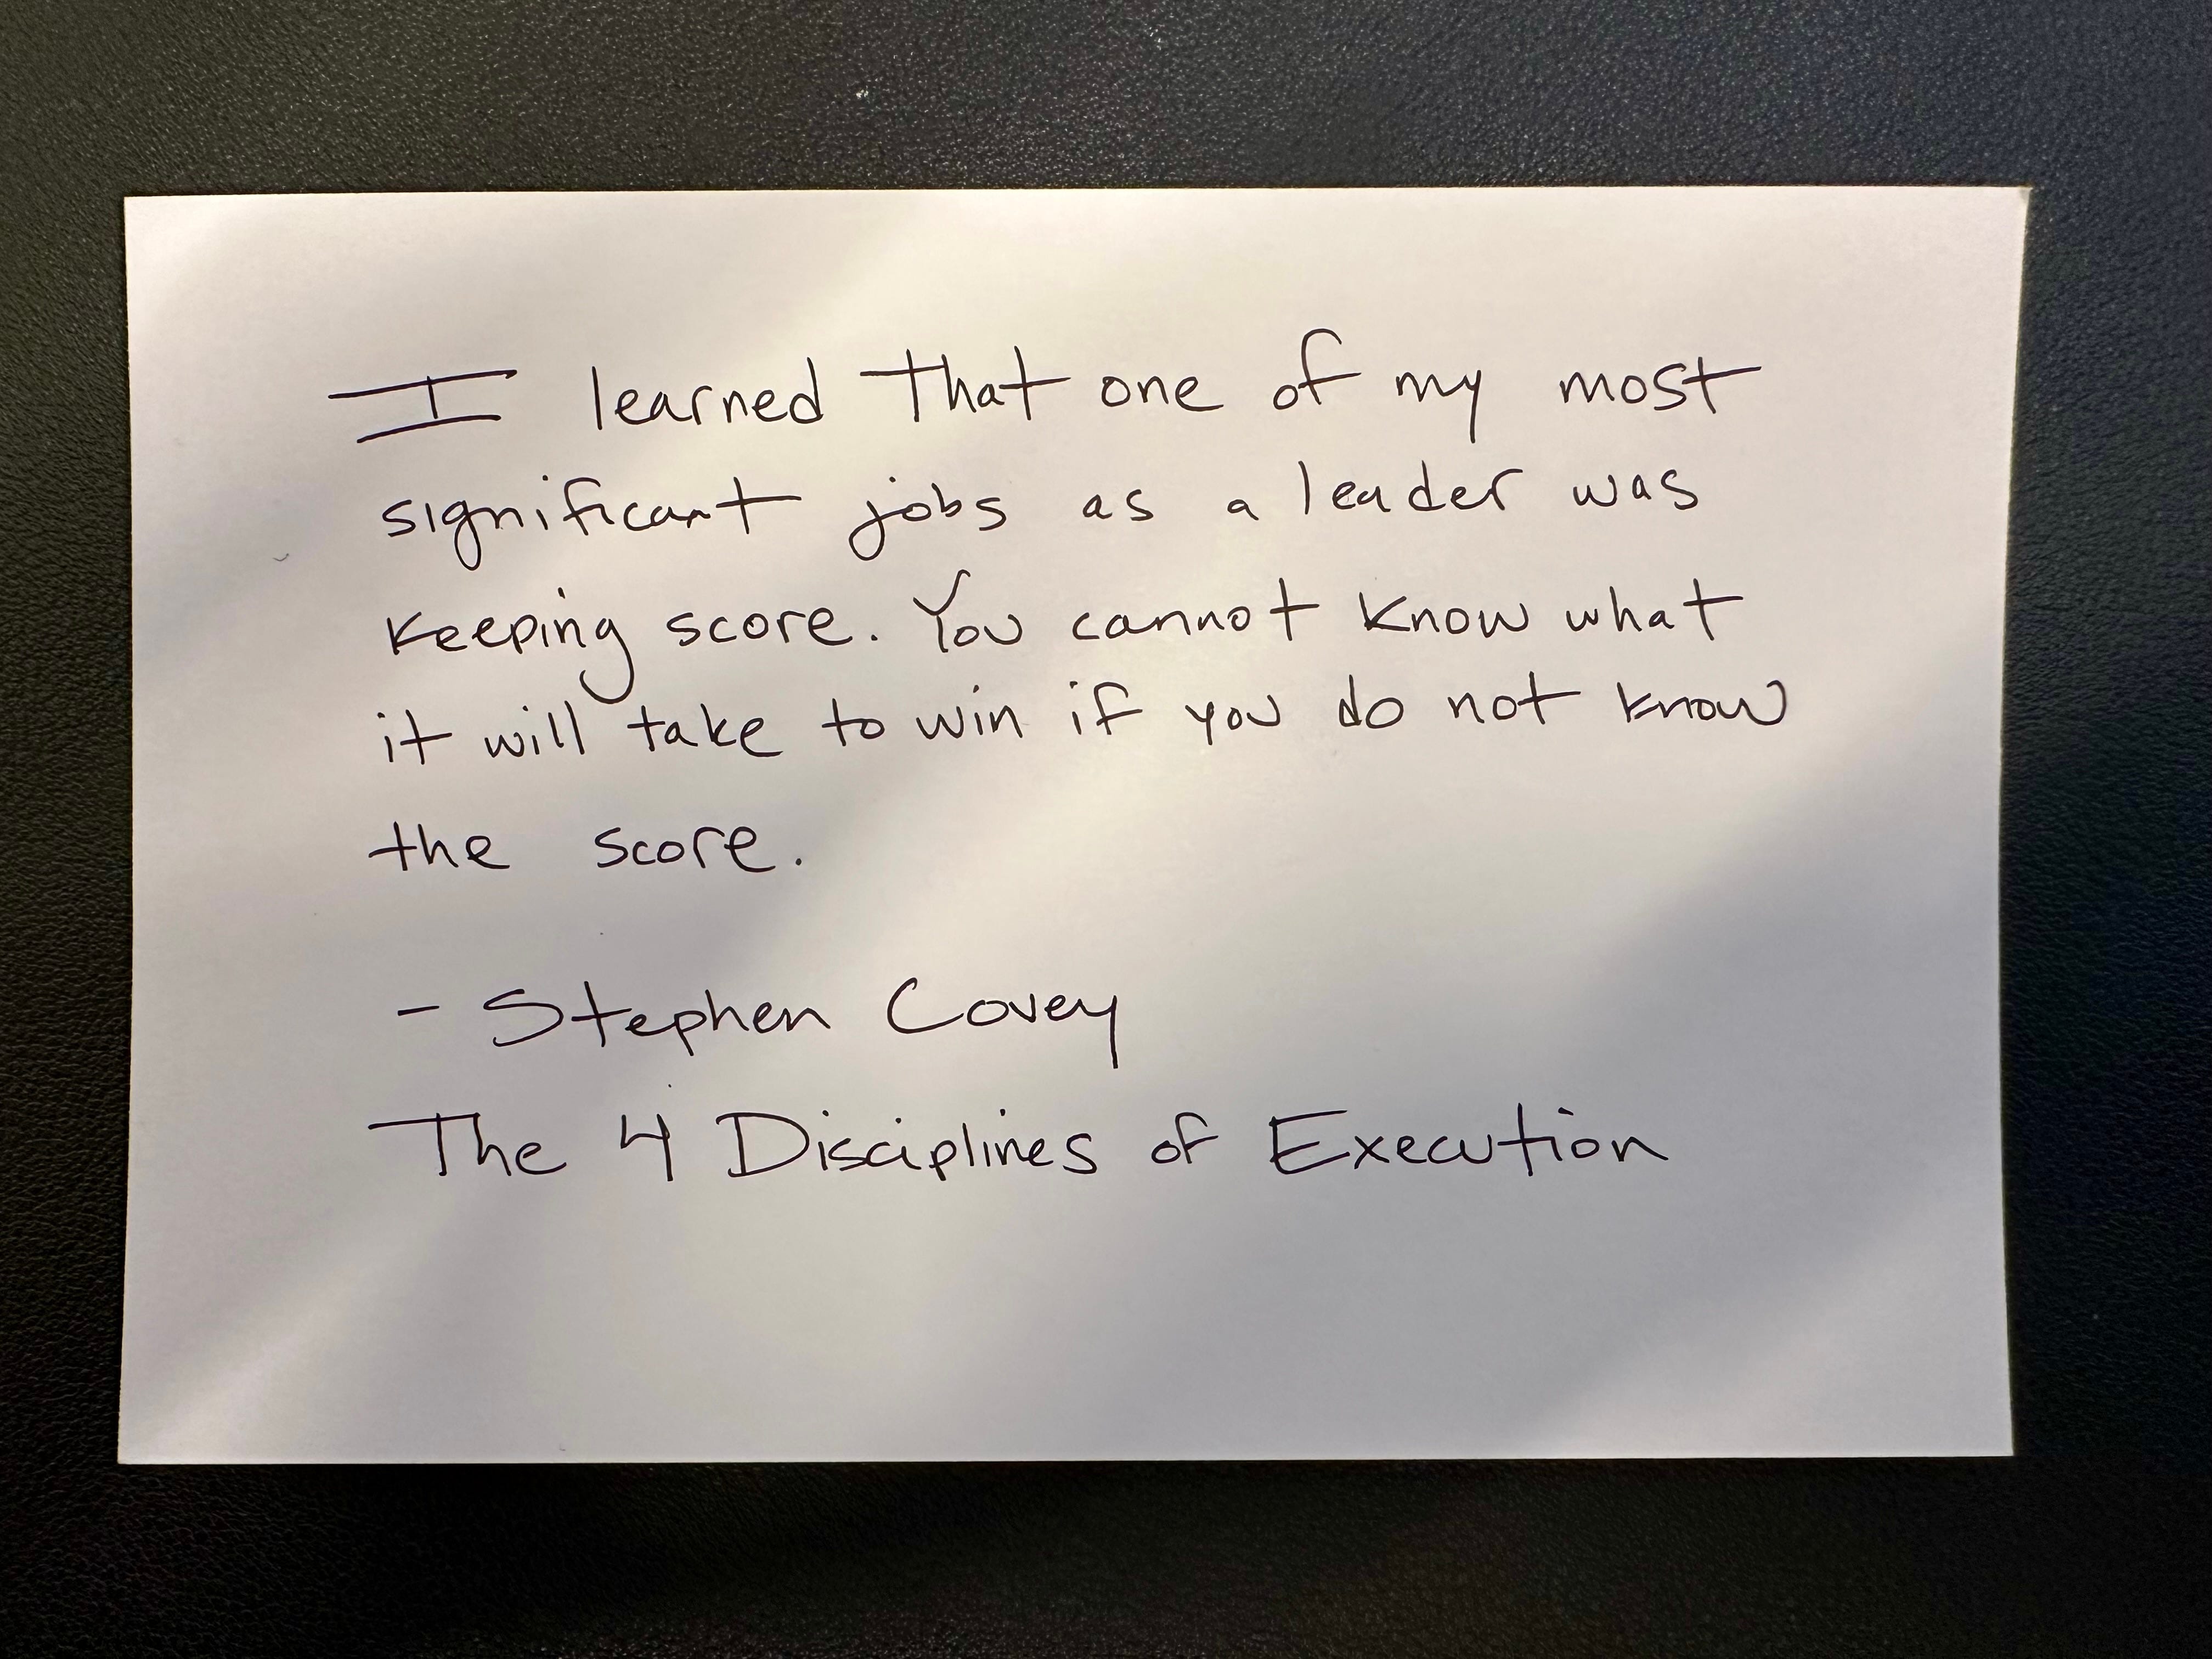
Stephen Covey has this great line about numbers being part of leadership identity in his phenomenal book, The 4 Disciplines of Execution:
Ok, we get it. Good leaders are data-driven. But here’s a common misconception about this data-driven thing: This is not about replacing your instincts with spreadsheets. It’s about staying as connected as possible to the truth. To what’s actually happening, and to what you and your team need to do next to win. And embedded in this search for truth is a special kind of humility. We human beings aren’t all-seeing. It’s really hard to observe everything that’s going on when you have lots of employees and lots of customers to keep track of. Trying to do that without measuring things objectively - without leaning on numbers to at least help tell you what’s going on - is really, really hard. Your own five senses can only take you so far. Numbers are the effective leader’s sixth sense.
And good news. Being data-driven is not an innate quality. It’s learnable. Data-driven leaders aren’t gifted. They’re trained. And teaching people and companies how to be more data-driven is one of my most important jobs inside of our portfolio.
The Data-Driven Playbook
Here are the tools and frameworks (linked below in the headers) I use with our companies to make the job of knowing, using, and leading with your numbers a little easier.
1. What It Means to Be Data-Driven
Being data-driven isn’t just a mindset. It’s a behavioral loop, made up of three distinct habits: Picking the right metrics, sharing a simple weekly report, and acting decisively on the insights revealed. This article lays out why each of those habits matter, how they compound on top of each other, and how data-driven people build them into their weekly calendar and how they meet with their team.
2. How to Build Your Data Diet
Being data-driven starts with selecting the right datapoints and organizing them into a simple system. This article teaches you how to ask the right questions, define the metrics that answer those questions, and decide when to review them (weekly, monthly, or less often) so you strike the perfect balance: enough data to stay sharp, but never so much that reviewing it becomes your full-time job.
3. What Reporting Is Really For
There’s a term from the French culinary world - mise en place. Translated, it means “everything in its place.” In a professional kitchen, mise en place is all about organizing your ingredients so they’re easy to reach and ready to use before you start cooking. The best data-driven leaders use this same principle for reporting: they design simple weekly reports that put the right data in the right place at the right time, making it easier to absorb and revealing insights that might otherwise stay hidden.
This article explores how to apply the mise en place mindset to your reporting, using the “Less Data, More Often” approach to help you start answering the most important questions for your business without overcomplicating things.
The Data-Driven Interview Guide
It’s hard to argue with the benefit of having a data-driven person on your team. But how do you test for this stuff? It’s hard. Interviewees know they’re supposed to talk about the results they helped create. Pretty much everyone can list off at least a few metrics they pay attention to or can take credit for. So what can you ask to make it obvious who is using their data to create an unfair advantage - and who is just throwing up a smokescreen?
Here’s the two-part question I ask senior executives to figure out whether they’re data driven or not.
Part 1: Measuring What Matters
Q1: Tell us about the 3-5 most important metrics you track each week. What are the metrics? Why are they important? When do you review them, and what are you paying attention to when you do?
Here, I’m testing for the person’s ability to prioritize, their level of clarity on how metrics are defined, and proof that they’re not just reporting but actively using the numbers. I want to see a mix of leading and lagging indicators tied to their plan and budget, with a clear understanding of where the data comes from and how they’ve built a repeatable process to track it.
Answers like “I look at revenue” (which, yes, more than one person has led with - yikes) are way too basic. But so is a long list of twenty “look at all the data I can look at” metrics. Great answers are concise but thoughtful, and include a good mix of leading and lagging measures, a cadence for review, and rationale for how the metrics connect back to what matters most for their company or the team.
Part 2: Taking Action
Q2: Now using that list, tell me about a time you spotted a challenge or an opportunity in those metrics and then did something about it.
This question is all about their ability to spot trends and act. I’m looking for a story where they used the numbers as an early warning sign, noticing a trend, digging deeper to understand what was going on, building a plan to address it, and then using the data to measure the impact of their actions.
Great answers are great stories, and include spotting a problem, doing the work to uncover its cause, and making simple, effective adjustments to course-correct. I’m looking for a pattern of curiosity, action, and follow-through. And I’m looking for people who use numbers and qualitative (read: human) observations to build their perspective on what’s going on, what their options are, and what they should do about it. I’m also not afraid to go deep on this second part. In a senior leadership or CEO interview, we’ll often spend 30 minutes or more on this “what did you do with the metrics” story. When you get that detailed and ask that many follow-up questions, it’s almost impossible to fake your way through it. (Part of the reason I don’t mind publishing the interview questions here.)
Final Thoughts
“Data-driven” is one of those terms that’s been tossed around so much it’s started to lose its meaning. This is what it means to me:
Data-driven is a way of being. It’s a standard you set for yourself and your team. It’s about doing the work to create honest answers to great questions. It’s about refusing to settle for guesswork, anecdotes, story-time, or laziness. It’s about cutting through the noise to see the truth, even if it’s a uncomfortable. And it’s about using that truth to spot problems, commit to actions, and notice if what you’ve decided to try is actually working. It’s about having the discipline to measure what matters, the will to hold yourself accountable to results, and the belief that what you need to win is right there in the numbers.
All you have to do is look.
Weekly business reviews and XMR charts are the path here. Lots of power in simply looking at the data, in a consistent format, every single week.